|
What is Liquefaction?
The loss of soil stiffness and strength in loose- to medium-dense, saturated sandy soils due to liquefaction is a leading cause of damage to foundations during earthquakes. Soil liquefaction can result in a variety of failure modes that compromise the integrity foundations. Specific examples include loss of foundation stability due to reduced bearing capacity, deep-seated instability and damage to deep foundations, increased lateral earth pressures on earth retention structures, loss of passive soil resistance against walls, anchors, and laterally loaded piles, reduction of axial capacity of piles, and post-liquefaction settlement of soils. Bridge foundations in soil are particularly vulnerable to liquefaction hazards at waterfront sites where the ground slopes to the body of water, or a free-face condition exists allowing the soil to move in response to static, driving shear stresses. Soil liquefaction is a fatigue mode of failure wherein undrained cyclic loading leads to a progressive increase in excess pore pressure in the soil. The increase in pore pressure is accompanied by an equal decrease in the effective confining stress, reducing the shear resistance of the soil. In order to assess the likelihood of liquefaction at a site, the cyclic resistance of the soil and the nature of the design-level earthquake ground motions must be established. The factor of safety against the triggering of liquefaction is simply the ratio of the cyclic resistance of the soil to the cyclic loading induced by the earthquake of interest. In engineering practices the cyclic resistance of the soil to the generation of excess pore pressures is routinely estimated using empirical procedures based on soil density and stiffness. The results of in situ testing methods such as the Standard Penetration Test, Cone Penetration Test, and Shear Wave Velocity measurements are used for this purpose. |
How is a Liquefaction Hazard Evaluated?
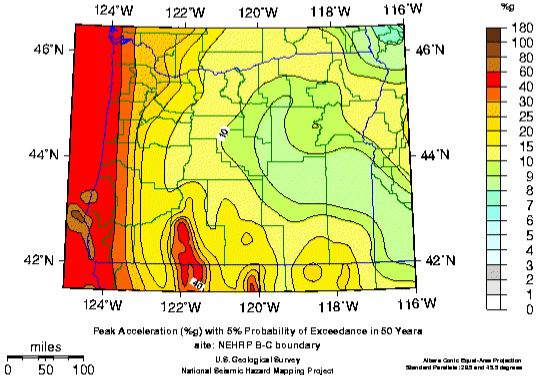
A common method of estimating strong ground motions involves assigning a Maximum Credible Earthquake to a specific fault, then using an attenuation relationship to determine the Peak Ground Acceleration (PGA) at the project site. This method, referred to as the deterministic approach, focuses only on the largest reasonably possible earthquake associated with a source. The advantage of this approach for liquefaction hazard evaluation is that both the intensity of ground shaking (PGA) and the duration of the motions, as related to the earthquake magnitude, are known. The primary disadvantages of this approach are that the PGA values do not necessarily reflect the cumulative, or aggregate, hazard in the region, and that assessing the influence of uncertainties in factors such as earthquake magnitude or source-to-site distance on the resulting PGA are accounted for by performing additional parametric studies of each variable. As an alternative to the deterministic method of estimating PGA, probabilistic procedures can be used that combine the contributions of all sources in a cumulative estimate of the ground motion parameter of interest. Probability distributions of key variables such as rupture location along a fault, location of random sources, seismicity rates, and ground motion estimates from attenuation relationships can be incorporated into one seismic hazard analysis. Uncertainties associated with other factors such as the likelihood of activity along mapped faults, the direction of fault rupture propagation, and predominant style of faulting can be incorporated into the evaluation. A primary advantage of probabilistic seismic hazard analysis is that by assigning locations and seismicity rates to all sources the ground motion parameter of interest expected at a specific site can be determined along with its probability distribution, which is useful for illustrating uncertainty in the ground motion variable. Repeating the analysis for multiple locations, specified as grid points, throughout a region allows for the creation of contour maps of the ground motion parameters for specified exposure intervals. These maps have been referred to as “uniform” or “aggregate” hazard maps as the contributions of all sources have been incorporated into a single ground motion value. An example for peak horizontal accelerations at rock sites in Oregon having a 5 percent probability of exceedance in 50 years (i.e. 975 year average return period) is shown below. The map provides the spatial variation in PGA due to all of the seismic sources in the region. This map is similar in form to the ground motion maps used in seismic design provisions and codes for buildings. |
- Welcome
- PORTFOLIO
-
Services
-
Geotechnical Engineering
>
- Geotechnical Explorations >
-
FOUNDATION ENGINEERING
>
- GEOLOGICAL ENGINEERING >
- Septic Engineering >
- PHASE I-III ASSESSMENTS
- ENVIRONMENTAL ASSESSMENTS >
- Site-Specific Seismic Evaluations >
- BUILDING ASSESSMENTS >
- Retaining Walls
- Shoring
- Pin Piles
- Gabion wall
- HELICAL PIER
- Structural Retrofitting
- MANTA RAY ANCHORS
- GEOPHYSICS
- PAVEMENTS / PUBLIC WORKS >
- SOFTWARE >
-
Geotechnical Engineering
>
- Contact Us
- Employment
- Library
- Florida Geo Services
- Blog
- Landing 2024


